Appendix A5 - LiDAR ranging and waveforms
An elevated horizontal board and an inclined board stand above flat ground. A zero-divergence control checks intersections, occlusion, echo energy and propagation delay. A finite footprint then crosses the elevated board's edge to test two returns and beam-sampling stability. A second arrangement with a slit tests occlusion between two board levels, oblique views and three returns.
Scene and observations
Drag to rotate and select the beam type and backend, or open the 3-D preview. Blue rings mark direct geometric points, orange points come from waveforms, and black crosses are analytic intersections.
The scene is 10 m × 10 m with open boundaries and no atmospheric attenuation. Ground is at Z = 0. The horizontal board is at Z = 4 m, covering X = 5–9 m and Y = 1–4 m. The inclined board covers X = 1–4 m and Y = 6–9 m, with Z = 0.5 + 0.5X. All surfaces are opaque Lambertian reflectors, with reflectances of 0.25, 0.6 and 0.4 respectively. Solar irradiance is zero.
| Parameter | Setting |
|---|---|
| Wavelength | 1064 nm |
| Pulse energy | 1 J |
| Receiver aperture area | 0.1 m² |
| Emitted pulse | Gaussian, 1 ns full width at half maximum |
| Range window | 0–14 m |
| Range-bin width | 0.025 m |
| Scanner height | 10 m |
These settings test the numerical relationships and do not describe a particular instrument.
Zero-divergence controls
Vertical views observe the ground and both boards. Additional views are 30° from nadir for the ground and horizontal board and 15° from nadir for the inclined board. An upward pulse tests the empty cloud and zero waveform when there is no intersection. All station coordinates and directions are in the input file.
With zero divergence, fast_point_cloud returns the central ray's geometric intersection. waveform returns the full waveform and its extracted discrete points. The latter have range-bin quantization; the two products are evaluated separately.
Finite footprint
The beam points vertically downward with a 50 mrad half-angle. Its footprint radius at the elevated board is
Beam centres are at Y = 2.5 m and X = 5 + qa_s, with q = −1.25, −0.35, 0, 0.35 and 1.25. These cover ground only, two off-centre partial occlusions, a centred edge, and board only.
The footprint has a Gaussian energy profile truncated at the unit disk; edge intensity is 0.368 of central intensity. The larger divergence makes partial occlusion visible in this small scene.
Finite-beam discrete returns are located on the pulse axis at waveform-derived ranges. They represent the footprint's return, rather than an exact surface intersection of one subray.
Independent reference
Intersections, delay and energy
For a plane \(\mathbf n\cdot\mathbf x=b\), a ray from o along unit direction d intersects at
The nearest positive intersection within a board's bounds determines occlusion. Monostatic delay is \(t=2R/c\). For the ideal receiver used here, Lambertian echo energy is
where \(E_0\) is incident pulse energy, A is receiver area and θ is the incidence angle to the surface normal. Zero-divergence points, ranges and energies therefore have analytic references.
Continuous pulses and range bins
For pulse FWHM w, the corresponding range standard deviation is
An echo at continuous range R contributes to bin \([e_b,e_{b+1}]\) as
where Φ is the standard-normal CDF. The reference integrates the continuous pulse before comparing each simulated range bin.
Continuous footprint and board edge
The finite-beam reference does not use LESS's beam grid. With normalized radius r and k = −ln(0.368), radial energy density is
The angular fraction at radius r that falls on the board is
For a horizontal surface separated vertically by \(h_j\), \(R_j(r)=h_j\sqrt{1+r^2\tan^2\alpha}\). Integrating these fractions, Lambertian return energy and Gaussian bin fractions over r gives the reference waveform.
Angular fractions are analytic. The remaining radial integral is evaluated independently with 256- and 512-order Gauss–Legendre quadrature, checking reference refinement separately. The zero-divergence comparison is analytic; the finite-footprint comparison uses an independent semi-analytic integral.
Simulation results
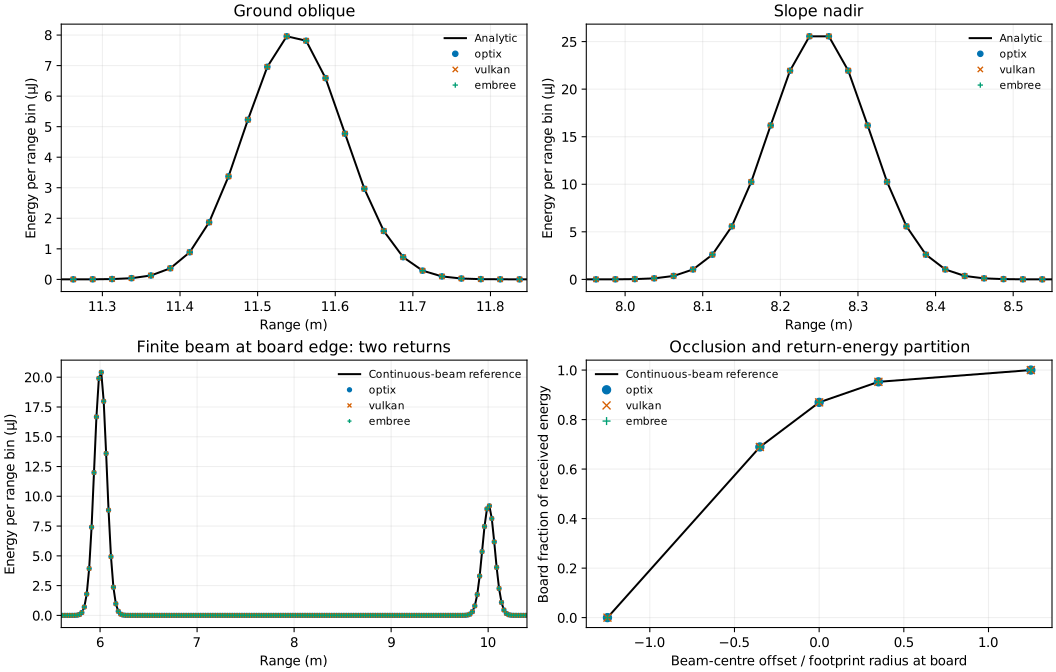
The ordinate is received energy per range bin. The two finite-beam peaks come from the board and ground. The lower-right plot compares the board's fraction of total received energy.
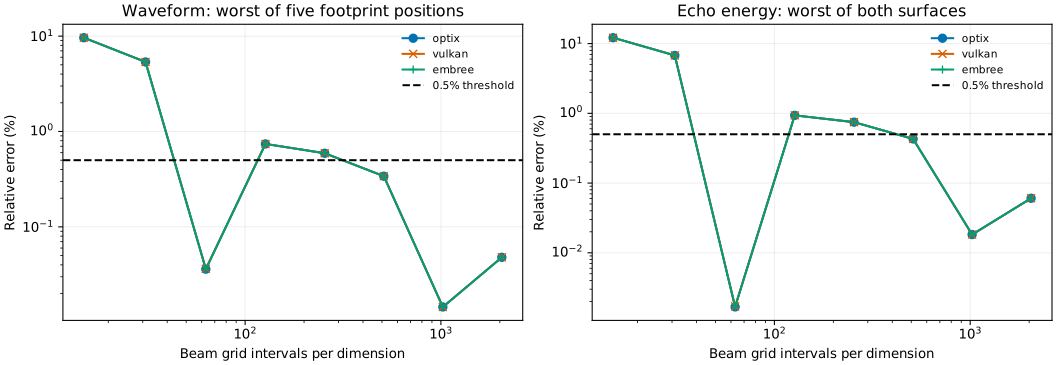
Zero-divergence controls use beam_samples = 1, 7 and 31 to check sampling invariance. Finite beams use 15, 31, 63, 127, 255, 511, 1023 and 2047, adopting 2047 for the final result. This is a per-dimension sampling parameter: the final circular grid contains about 3.3 million nodes per pulse. The alignment of board edges with beam-grid nodes can make local errors nonmonotonic, so both reference error and the last-budget change are checked.
Waveform relative error is \(\sum_b|W_b-W_b^{ref}|/\sum_bW_b^{ref}\). Pulse width is obtained from the second moment of the binned waveform and compared with the identically binned reference.
| Metric | Threshold |
|---|---|
| Direct intersection position error | ≤ 0.00003 m |
| Direct echo-delay error | ≤ 0.0002 ns |
| Zero-divergence echo-energy relative error | ≤ 0.005% |
| Zero-divergence waveform relative error | ≤ 0.005% |
| Finite-beam waveform and per-surface echo-energy relative errors | ≤ 0.5% |
| Binned pulse-width difference | ≤ 0.005 ns |
| Waveform change between the final two beam budgets | ≤ 0.3% |
| Finite-beam discrete return-range error | ≤ 0.025 m |
| Independent radial-reference refinement change | ≤ 0.001% |
| Backend | Point error / m | Zero-divergence waveform error | Finite-beam waveform error | Per-surface energy error | Last-budget change | Result |
|---|---|---|---|---|---|---|
| optix | 3.42e-07 | 0.00105% | 0.0480% | 0.0605% | 0.0335% | Pass |
| vulkan | 3.42e-07 | 0.00032% | 0.0480% | 0.0605% | 0.0335% | Pass |
| embree | 1.76e-07 | 0.00034% | 0.0480% | 0.0605% | 0.0335% | Pass |
All three backends pass. The largest direct echo-delay error is 4.56e-06 ns; the largest binned pulse-width difference is 0.00000113 ns. Maximum reference-refinement change is 6.63e-09. Each of the three partial-occlusion positions produces two returns; each full-surface position produces one.
Three-dimensional occlusion and multiple returns
A second arrangement uses an upper board with a slit, a lower half-board and the ground. The upper board is at Z = 6 m, spans X = 2–8 m and Y = 4–6 m, and has an opening at X = 4.9–5.1 m. The lower board is at Z = 3 m and spans X = 5–8 m and Y = 4–6 m. The ground remains at Z = 0. Their reflectances are 0.6, 0.4 and 0.25, respectively. Select an “Occlusion” option in the viewer above to explore this arrangement. Laser and receiver parameters remain the same as above.
Zero-divergence beams aim at the solid upper board, the lower board through the slit, and the ground through the slit. Two more beams pass through the slit from opposite sides at 20° off nadir. The nearest valid plane intersection provides the exact surface, position, range, energy and travel time.
Finite beams retain a 50 mrad half-angle and use five views:
| View | Configuration | Expected returns |
|---|---|---|
| Slit centre | Nadir from (5, 5, 10) | Upper board, lower board, ground: 3 |
| Slit edge | Nadir from (4.9, 5, 10) | Upper board, lower board, ground: 3 |
| Eastward look | 20° off nadir, axis through the upper slit centre | Upper and lower boards: 2 |
| Westward look | 20° off nadir, axis through the upper slit centre | Upper board and ground: 2 |
| Fully blocked | Nadir from (4.4, 5, 10) | Upper board only: 1 |
Each sub-ray contributes its nearest opaque-surface intersection. Multiple returns arise when different parts of the finite beam reach different heights. A zero-divergence beam through the slit produces just one return.
Independent waveform reference
Express the continuous footprint in polar coordinates and split its angular intervals at the exact projected slit and lower-board edges. Within each interval, compute the nearest plane intersection, incidence cosine and travel distance, then integrate the Lambertian energy and Gaussian range-bin energy defined above. The reference uses polar integration, independently of the simulated beam grid. Reference refinement compares radial orders 64 and 128, with corresponding angular quadrature.
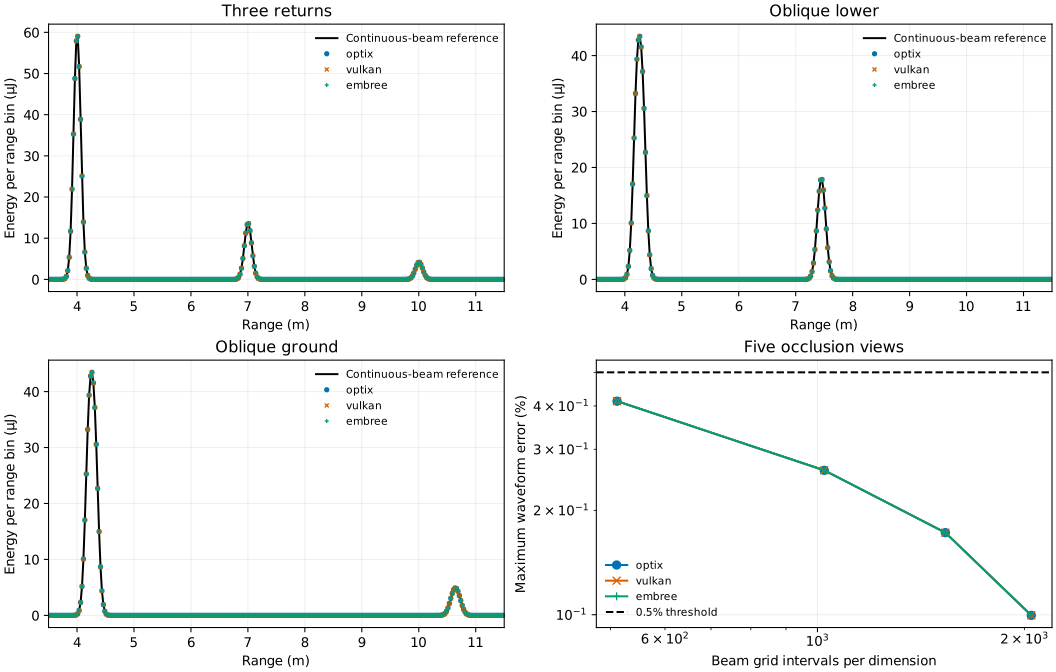
The first three panels show the three-return, eastward and westward views; black curves are the continuous-footprint reference. The final panel shows the maximum waveform error across all five views. Zero-divergence sampling uses 1, 7 and 31; finite-beam sampling uses 511, 1023, 1535 and 2047, adopting 2047. Existing waveform, energy, range, width and final-budget thresholds are retained. Return counts and numbering must also match, separation errors must not exceed 0.05 m, and energy assigned to completely blocked surfaces must not exceed a fraction of \(10^{-8}\).
| Backend | Maximum waveform error | Maximum component energy error | Final budget change | Return counts and occlusion |
|---|---|---|---|---|
| optix | 0.0996% | 0.1134% | 0.0729% | Pass |
| vulkan | 0.0996% | 0.1134% | 0.0729% | Pass |
| embree | 0.0996% | 0.1134% | 0.0729% | Pass |
All 30 added backend/view combinations pass. Fully blocked lower surfaces contribute zero energy, and the slit and oblique views have the expected return counts, numbering and ordering.
Download and reproduce
- Inputs and final sampling plan
- Elevated board, inclined board
- Upper board with slit, lower half-board
- Reproduction script
- Current results
Keep the relative paths of the script and data/lidar/. The independent reference requires SciPy; plotting also needs Matplotlib:
python scripts/appendix_lidar.py --output build/tutorial-lidar
python scripts/appendix_lidar.py --plot-only build/tutorial-lidar/results.json --output build/tutorial-lidar
With the result data downloaded, add --occlusion-only to recompute only the occlusion section.